Logistic Regression from Logit
1. What is Logit?
To discuss logit, we need to know what the odds is.
Simply say, Odds is $\frac{p}{1-p}$, where $p$ is the probability of a binary outcome.
Since the odds has different properties than probability, it allows us to make new functions or new graphs.
With the properties of odds, logarithm of odds is popularly used in machine learning industry, which is called logit.
Logit (also log odds) = $log(\frac{p}{1-p})$.
Let logit be defined as $\theta$, then
$$\theta = log(\frac{p}{1-p})$$
We can express this in terms of $p$ as the following,
$$e^{\theta} = \frac{p}{1-p} \\ (1-p)e^{\theta} = p \\ e^{\theta} = p + p e^{\theta} \\ e^{\theta} = p(1+e^{\theta}) \\ \therefore p = \frac{e^{\theta}}{(1+e^{\theta})} = \frac{1}{1+e^{-\theta}}$$
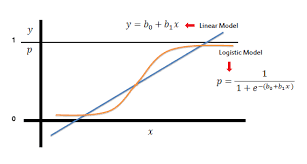
This is the logistic function, which is the special case of sigmoid function that is widely used for classification, such as logistic regression, tree-based algorithm for classification, or deep learning.
The logistic function is the CDF of the logistic distribution.
2. Logistic Distribution
A property of the logistic distribution is that the logistic distribution is very similar with the normal distribution except for the kurtosis.
The PDF of the logistic distribution is defined as,
$$f(x; \mu, s) = \frac{e^{-\frac{(x-\mu)}{s}}}{s(1+e^{-\frac{x-\mu}{s}})^2}$$
The CDF of the logistic distribution is defined as,
$$F(x; \mu, s) = \frac{1}{1+e^{-\frac{x-\mu}{s}}}$$
Some simulations are performed in this paper, and the simulation was to measure the absolute deviation between the cumulative standard normal distribution and the cumulative logistic distribution with mean zero and variance one.
By the paper, “the cumulative logistic distribution with mean zero and variance one is known as $(1+e^{-\nu x})^{-1}$ “
And, the paper also states that the kurtosis of the logistic distribution is effected by the parameter coefficient, $\nu$.
With the $\nu = 1.702$, the deviation is 0.0095.
As a summary, the logistic distribution approximately follows the normal distribution with the variance $\sigma^2$, and we could use the property of the normal distribution as the following;
By wikipedia,
“If a data distribution is approximately normal, then about 68 percent of the data values are within one standard deviation of the mean (mathematically, $\mu \pm \sigma$, where $\mu$ is the arithmetic mean), about 95 percent are within two standard deviations ($\mu \pm 2\sigma$), and about 99.7 percent lie within three standard deviations ($\mu \pm 3\sigma$).”
3. Logistic Regression
In a binary logistic regression, the outcome is binary, which can be said that it follows binomial distribution.
Let $y_i$ = number of successes in $m_i$ trials of a binomial process where $i = 1,…,n$, and we have a single predictor, $x_i$.
Then,
$$y_i | x_i \sim Bin(m_i, \theta(x_i))$$
By the definition of binomial distribution,
$$P(Y_i = y_i | x_i) = \binom{m_i}{y_i}\theta(x_i)^{y_i}(1-\theta(x_i))^{m_i-y_i}$$
As I discussed in this post, Likelihood, we can find the optimal distribution for the given data.
$$\mathcal{L}(\theta | x) = \mathcal{L}(distribution | data)$$
And with the optimal distribution given by the maximum likelihood, we can predict the probability.
$$P(data | distribution)$$
Then, the likelihood function for Logistic Regression will be
$$\mathcal{L} = \prod_{i=1}^{n} P(Y_i = y_i | x_i) \\ = \prod_{i=1}^{n}\binom{m_i}{y_i}\theta(x_i)^{y_i}(1-\theta(x_i))^{m_i-y_i}$$
We take log for the likelihood function to differentiate easier because maximizing likelihood is the same with maximizing log-likelihood.
The log-likelihood function will be
$$log(\mathcal{L}) = \prod_{i=1}^{n}[log(\binom{m_i}{y_i}) + log(\theta(x_i)^{y_i}) + log((1-\theta(x_i))^{m_i - y_i})] \\ = \prod_{i=1}^{n}[y_{i} log(\theta(x_i)) + (m_i - y_i)log(1-\theta(x_i)) + log(\binom{m_i}{y_i})] \\ = \prod_{i=1}^{n}[y_{i} log(\frac{\theta(x_i)}{1-\theta(x_i)}) + m_{i} log(1-\theta(x_i)) + log(\binom{m_i}{y_i})] \\ = \prod_{i=1}{n}[y_{i}(\beta_{0} + \beta_{1}x_{i}) - m_{i}log(1+exp(\beta_{0}+\beta_{1}x_{i})) + log(\binom{m_i}{y_i})]$$
Here, the $\theta(x_i)$, which is the probability, is defined as
$$\theta(x_i) = \frac{1}{1+e^{-(\beta_0 + \beta_1 x_i)}}$$
And, the linear combination of $\beta$ and $x$ will be the log odds as the following,
$$log(\frac{\theta(x_i)}{1-\theta(x_i)}) = \beta_0 + \beta_1 x_i$$
Just taking the derivative on the log-likelihood function and setting this as zero is hard to solve the problem, so the parameter $\beta_0$ and $\beta_1$ can be estimated by some other optimization method, such as Newton’s method.
4. Wald Test in Logistic Regression
Wald Test uses the property of the logistic distribution.
As mentioned above, the logistic distribution is almost approximately standard normal distribution.
Hence, the Wald test statistic is used to test
$$H_0 : \beta_1 = 0$$
in Logistic regression.
The Wald test statistic is defined as
$$Z = \frac{\hat{\beta_1} - \beta_1}{estimated \qquad se(\hat{\beta_1})}$$
In the test, $\beta_1 = 0$ as the null hypothesis, and this follows standard normal distribution.
Hence,
$$Z = \frac{\hat{\beta_1}}{\hat{se}(\hat{\beta_1})} \sim \mathcal{N}(0,1)$$
As mentioned above, the logistic distribution is approximately following the normal distribution with variance, $\sigma^2$.
Hence, dividing by the standard error for the estimated paramter gives you standard normal distribution, $\mathcal{N}(0,1)$.
We can determine the coefficient significant with the Wald Test for the Logistic Regression.
4. Interpretation for coefficients of Logistic Regression.
Unlike Linear Regression, the linear combination of coefficients of Logistic regression is logit.
Hence, we can interpret the coefficient in different way.
For example, with the single predictor as used above, the logit is
$$log(\frac{p}{1-p}) = \beta_0 + \beta_1 x_i$$
If we take exponential both sides,
$$\frac{p}{1-p} = e^{(\beta_0 + \beta_1 x_i)}$$
Then, we can say as following,
“For one-unit in $x_i$ increase, it is expected to see ..% increase in odds of success, $p$”.
Reference:
A Modern Approach to Regression With R by Simon J. Sheater, Springer
A logistic approximation to the cumulative normal distribution
Standard Deviation
Logistic Distribution


