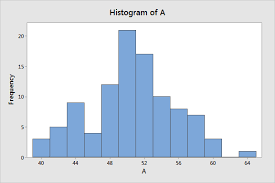

Creating Histogram function using Min-max transformation.
The histogram plot of a vector or a data feature is to create bins, which is to create a series of interval, for the range of data values, and to count how many data values fall into each bins.
I create bins as the following;
Suppose we have $M$ bins, then
$$B_1 = [0,\frac{1}{M}), B_2 = [\frac{1}{M}, \frac{2}{M}), …, B_{M-1} = [\frac{M-2}{M}, \frac{M-1}{M}), B_{M} = [\frac{M-1}{M}, 1)$$
To create histogram function with the bins, I wanted to transform the data elements in interval $(0,1)$, so I can put them into each bins.
That’s why I used Min-max transformation, which makes the data reducing to a scale between 0 and 1.
Min-max transformation is the following formula;
$$z = \frac{x-min(x)}{max(x)-min(x)}$$
The below codes are the implementation of creating histogram plot in R. I used the values from CLT posts.
1 |
|
1 | Hist(sampled.1000,15) |

1 | Hist(sampled.10000,15) |

1 | Hist(bin.sampled.10000,15) |

Reference:
Histogram and Kernel Density EStimation
Histogram from Scratch