Optimizers

Deep Neural Networks

Simple Intro to DNN

DNN(Deep Neural Networks) is a deep structured model of ANN(Artificial Neural Networks), which is a type of machine learning inspired by biological neural networks. DNN is used and applied widely in many fields such as computer vision, speech recognition, natural language processing, and bioinformatics.

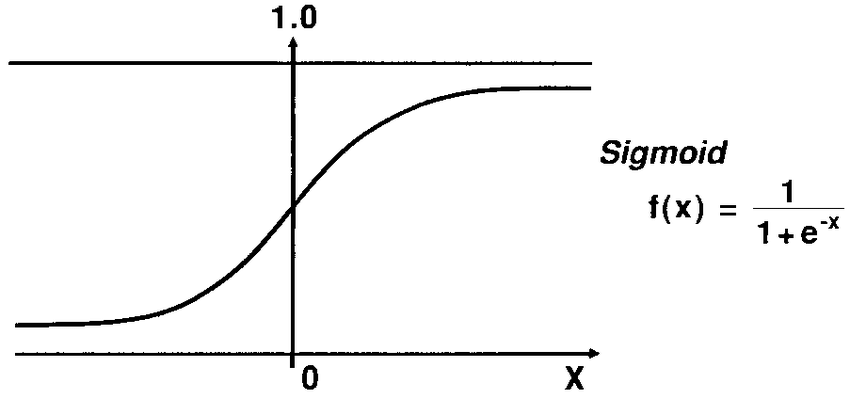
For my understand, ANN is to stack many models with various weights and biases such as logistic regression models, and DNN is a complex body that consist of huge amount of models. Therefore, some DNN model has more than 20 million parameters such as Xception invented from Google.

As any other complexity in this world brings about problems, DNN has some problems that has to be solved. DNN suffers slow computational time because it has more than millions parameters to learn. And it also suffers the vanishing/exploding gradients problems. Because it has all the different models, which are neurons, with all the different weights and biases, the gradients of some neurons to update each weights and biases will be too small or too large. In this case, we say that the neurons with too small or too large gradients are dead neurons.

There are many approches to alleviate those problems such as dropout, initializer, or batch normalization.

I am going to disscuss about efficient optimizers rather than Stochastic Gradient Descent, which is one of ways for those difficulties.

SGD (Stochastic Gradient Descent)

Let’s begin with talking about what the SGD is.

Regular Gradient Descent is to simply updates the weights by calculating and subtracting the gradient of cost function with regards to the weights to reach the global optimum so that we can minimize our cost function.

Definition:

$$\theta \leftarrow \theta - \eta\Delta_{\theta}\mathcal{J}(\theta)$$

The formula in the definition is to update the weights by subtracting or adding the gradients of cost function to take small steps down the slope.

So SGD does not care about the previous weights or gradients, but it only cares about current weights and gradients. This is where the Momentum optimization is introduced.

SGD with Momentum optimization

SGD with Momentum Optimization is simply added some vector in the process of SGD, which is called momentum vector.

Definition:

$$\mathcal{m} \leftarrow \beta\mathcal{m} - \eta\Delta_{\theta} \mathcal{J}(\theta)$$

$$\theta \leftarrow \theta + \mathcal{m}$$

We update the weight by updating the momenum vector as above. Let’s imagine that we starts with the first initialized weights at the first iteration. The moment vector, $\mathcal{m}$, is started with zero, then the weights, $\theta$, will be just updated by the gradients as Gradient Decsent does. At the second iteration, the momentum vector is the gradients calculated at the first iteration. We are updating the gradients of the first iteration, which is momentum vector, by subtracting or adding the gradients at the current step, and adding the updated the gradients or the momentum vector. At the third iteration, the momentum vector would be the updated momentum vector at the second iteration, which is calculated by the first gradients. We update the wegiths by updating and adding the momentum vector.

To prevent the momentum vector growing too large or too small, we slightly reduced the value by a hyperparameter, $\beta$, which is called momentum. If the momentum, $\beta = 0$, then it’s the same as SGD. The typical value of momentum is 0.9.

Nesterov Accelerated Gradient

A new Momentum optimization is introduced, which is called Nesterov Accelerated Gradient. In the original Momentum Optimization, we update the momenum vector at the local position of the current weight; however, in NAG optimization, we update the momentum vector with the gradient that is measured at $\theta + \beta\mathcal{m}$.

Definition:

$$\mathcal{m} \leftarrow \beta\mathcal{m} - \eta\Delta_{\theta}\mathcal{J}(\theta + \beta\mathcal{m})$$

$$\theta \leftarrow \theta + \mathcal{m}$$

Since this gradient has the information of both of the weight and the previous momentum, this will help update the gradient more accurate, improve the directions to the optimum, and eventually converges faster.

AdaGrad

AdaGrad is the different version of gradient descent optimization than the momentum based optimization. It’s scaling down the gradient vector by dividing some factors measured along the steepness of the gradient.

Definition:

$$s \leftarrow s + \Delta_{\theta}\mathcal{J}(\theta)\otimes\Delta_{\theta}\mathcal{J}(\theta)$$

$$\theta \leftarrow \theta - \eta\Delta_{\theta}\mathcal{J}(\theta)\oslash\sqrt{s + \epsilon}$$

In the first step, we update the factor s by adding the element-wise multiplication of the gradient elements, that is the square of the gradients. It will be the same as $s_{i} \leftarrow + (\partial \mathcal{J}(\theta)/\partial \Theta_{i})^2$ for each element $s_{i}$. The vector, s, will accumulate the squares of the partial derivative of the cost function with regards to parameter $\Theta_{i}$. Therefore, if the gradient of the cost function is big, the factor s will get larger and larger at each iteration.

In the second step, the gradient of the cost function will be divided by the square root of the factor that is updated with the square of the gradients in the first step. The $\epsilon$ is the smoothing term to prevent dividing by zero, if the factor, s, is zero.

To sum up, if the direction to the global optimum is steep at the $i^{th}$ iteration, then the factor gets larger and so the term, $\eta\Delta_{\theta}\mathcal{J}(\theta)\oslash\sqrt{s + \epsilon}$, will be smaller. However, because it’s scaling down the gradient quickly at each iterations, when it’s reaching to the optimum, the gradient will be too small.

RMSProp

Since AdaGrad is scaling down the gradients too quickly, a new hyperparameter, $\beta$, is applied into the first formula of AdaGrad to somehow reduce the speed of scaling down.

Definition:

$$\mathcal{s} \leftarrow \beta\mathcal{s} + (1-\beta)\Delta_{\theta}\mathcal{J}(\theta)\otimes\Delta_{\theta}\mathcal{J}(\theta)$$

$$\theta \leftarrow \theta - \eta\Delta_{\theta}\mathcal{J}(\theta)\oslash\sqrt{s + \epsilon}$$

The hyperparameter, $\beta$, is called decay rate, and the typical value is 0.9.

Adam

Adam stands for adaptive moment estimation. It is from the ideas of momentum and RMSProp. Adam is a well-performed optimization algorithm in most cases.

Definition:

$$1. \mathcal{m} \leftarrow \beta_{1}\mathcal{m} - (1-\beta_{1})\Delta_{\theta}\mathcal{J}(\theta)$$

$$2. \mathcal{s} \leftarrow \beta_{2}\mathcal{s} + (1-\beta_{2})\Delta_{\theta}\mathcal{J}(\theta) \otimes \Delta_{\theta}\mathcal{J}(\theta)$$

$$3. \hat{\mathcal{m}} \leftarrow \frac{m}{1-\beta_{1}^{t}}$$

$$4. \hat{\mathcal{s}} \leftarrow \frac{s}{1-beta_{2}^{t}}$$

$$5. \theta \leftarrow \theta + \eta\hat{\mathcal{m}}\oslash\sqrt{\hat{\mathcal{s}} + \epsilon}$$

The step 1 is to update the momentum vector with the idea of RMSProp, which is reducing the the speed of scaling the momentum vector by weighting each terms with the decay rate, $\beta_{1}$

The step 2 is to update the factor s, which is similar to the factor s in RMSProp.

The step 3 and 4 is to reweight the momentum vetor and the factor s by each decay rate. Because the momentum vector and the factor s will be initialized at 0, the $\mathcal{m}$ and $\mathcal{s}$ will be boosted from the beginning of training.

The step 5 is final step to update the weight, $\theta$, with all the parameters of $\mathcal{m}$ and $\mathcal{s}$ from above steps.

The typlical value of momentum decay rate, $\beta_{1}$, is 0.9, and the scailing decay hyperparameter, $\beta_{2}$, is set to 0.999.

Logistic Regression - Newton's method

Logistic Regression Algorithm with Newton’s Method

This post will somehow overlap the previous post, Logistic Regression I, since I will discuss about the Logistic Regression further the post.

We start with the Binomial Distribution.

Binomial Distribution

Let $Y$ be the number of success in $m$ trials of a binomial process. Then Y is said to have a binomial distribution with paramters of $m$ and $\theta$.

$$Y \sim Bin(m, \theta)$$

The probability that $Y$ takes the integer value $j$ ($j = 0, 1, …, m$) is given by,

$$P(Y = j) = \binom{m}{j} \theta^j (1-\theta)^{m-j}$$

Then, let $y_i$ be the number of success in $m_i$ trials of a binomial process where $i = 1, …, n$.

$$(Y = y_i|X = x_i) \sim Bin(m_i, \theta(x_i))$$

Sigmoid Function

In logistic regression for binary response variable, we use sigmoid function to figure out the optimization of loss function, or cost function, of logistic regression model because the sigmoid function can be differentiated.

Let we have one predictor variable, $x$, to predict binary outcome variable.

Then, sigmoid function is defined as below,

$$\theta(x) = \frac{e^{\beta_0 + \beta_1x}}{1 + e^{\beta_0 + \beta_1x}} = \frac{1}{1 + e^{-(\beta_0 + \beta_1x)}}$$

Here, the $\theta(x)$ is the probability of success.
Solving the equation for $\beta_0 + \beta_1x$,

$$\beta_0 + \beta_1x = log(\frac{\theta(x)}{1-\theta(x)}) $$
Here, the $\frac{\theta(x)}{1-\theta(x)}$ is known as odds, which can be described as “odds in favor of success”

The odds can be described as,

$$odds = \frac{Probability}{1-Probability}$$

As the previous posts, Logistic Regression I and Likelihood discussed, the likelihood and the probability in the dataset can be seen as,

$$\mathcal{L}(\theta | x) = \mathcal{L}(distribution | data)$$

$$P(data | distribution)$$

Then, if we find the optimal distribution given by the maximum likelihood or the minimum loss function, we can find the probability of the outcome.

Likelihood of Logistic Regression

Let $\theta(X) = \frac{1}{1+e^{-(X\beta)}}$, then the likelihood function is the function of the unkown probability of success $\theta(X)$ given by..

$$L = \prod_{i=1}^{n} P(Y_i = y_i|X = x_i) \\ = \prod_{i=1}^{n} \binom{m_i}{y_i} \theta(x_i)^{y_i} (1-\theta(x_i))^{m_i - y_i}$$

To simplify the likelihood, we take the log on the equation,

$$log(L) = \sum_{i=1}^{n}[log(\binom{m_i}{y_i}) + log(\theta(x_i)^{y_i}) + log((1-\theta(x_i))^{m_i - y_i})] \\ = \sum_{i=1}^{n}[y_ilog(\theta(x_i)) + (m_i-y_i)log(1-\theta(x_i)) + log(\binom{m_i}{y_i})] $$

Here, the all $m_i$ is equal to 1 for the binary outcome variable. Therefore,

$$log(L) = \sum_{i=1}^{n}[y_ilog(\theta(x_i)) + (1-y_i)log(1-\theta(x_i))] \tag{Eq 1}$$

The constant, $log(\binom{m_i}{y_i})$ is excluded here, since it won’t affect in optimization. The equation $(Eq 1)$ is the log likelihood function that we want to maximize. We take the minus sign for the log likelihood, which is the cost function of logistic regression.

Then, the cost function for Logistic regression is the normalization of the negative log likelihood function, which is the final cost function that we want to minimize.

$$J = -\frac{1}{n}\sum_{i=1}^{n}[y_ilog(\theta(x_i)) + (1-y_i)log(1-\theta(x_i))] \tag{Eq 2}$$

Newton-Raphson Method

This optimization method is often called as Newton’s method, and the form is given by,

$$\theta_{k+1} = \theta_k - H_k^{-1}g_k$$

where $H_k$ is the Hessian matrix, which is the second partial derivative matrix, and $g_k$, which is the first partial derivative matrix, is the gradient matrix.

It comes from the Taylor approximation of $f(\theta)$ around $\theta_k$.

$$f_{quad}(\theta) = f(\theta_k) + g_k^{T}(\theta - \theta_k) + \frac{1}{2}(\theta - \theta_k)^{T}H_k(\theta - \theta_k)$$

Setting the derivative of the function for $\theta$ equal to 0 to find the critical point.

$$\frac{\partial f_{quad}(\theta)}{\partial \theta} = 0 + g_k + H_k(\theta - \theta_k) = 0 \\ -g_k = H_k(\theta-\theta_k) \\ = H_k\theta - H_k\theta_k \\ H_k\theta = H_k\theta_k - g_k \\ \therefore \theta_{k+1} = \theta_k - H_k^{-1}g_k $$

Linear Regression with Newton-Raphson Method

In linear regression, the $\hat y$ is given by $X\theta$, and therefore, least squares, which is the cost function, is given by ..

$$f(\theta) = f(\theta; X, y) = (y-X\theta)^{T}(y-X\theta) \\ = y^Ty - y^TX\theta - \theta^TX^Ty + \theta^TX^TX\theta \\ = y^Ty - 2\theta^TX^Ty + \theta^TX^TX\theta$$

Then, the gradient is..

$$g = \partial f(\theta) = -2X^T y + 2X^T X \theta$$

The Hessian is..

$$H = \partial^2f(\theta) = 2X^TX $$

The Newton’s method for Linear Regression is..

$$\therefore \theta_{k+1} = \theta_k - H_k^{-1}g_k \\ = \theta_k - (2X^TX)^{-1}(-2X^Ty + 2X^TX\theta_k) \\ = \theta_k + (X^TX)^{-1}(X^Ty) - (X^TX)^{-1}X^TX\theta_k \\ \therefore \hat \beta= (X^TX)^{-1}X^Ty $$

Logistic Regression with Newton’s method

Recall that the cost function for logistic regression is described as $(Eq 2)$,

$$J = -\frac{1}{n}\sum_{i=1}^{n}[y_ilog(\theta(x_i)) + (1-y_i)log(1-\theta(x_i))] $$

Therefore, the gradient of the cost function is given by

$$g = X^T(\theta(X) - y)$$

the Hessian is given by

$$ X^TWX $$

Then, the $\beta$ is given by the Newton’s method

$$\theta_{k+1} = \theta_k - H_k^{-1}g_k \\ = \theta_k - (X^TWX)^{-1}(X^T(\theta_k(X) - y)) \\ \therefore \hat \beta = \theta_k - (X^TWX)^{-1}(X^T(\theta_k(X) - y))$$

Calculation of the results

The standard error for the coefficients are the square root of the diagonal elements of the Hessian matrix.

The z value is the

$$Z = \frac{\hat \beta}{estimated \qquad se(\hat \beta)}$$

and this statistic is used to test if $\beta = 0$, and it’s called a Wald test statistic.

As I dealt with the similarity of the logit with the standard normal distribution in the previous post, Logistic Regression I, we can use this statistic to test for statistical significance. The confidence interval can be calculated by

$$\hat \beta \pm z_{1-\alpha/2} \hat {se}(\hat \beta)$$

Implementation

functions}
1
2
3
4
5
6
7
8
9
10
11
12
13
14
15
16
17
18
19
20
21
22
23
24
25
26
27
28
29
30
31
32
33
34
35
36
37
38
39
40
41
42
43
44
45
46
47
48
49
50
51
52
53
54
55
56
57
58
59
60
61
62
63
64
65
66
67
68
69
#Sigmoid function - make cost function derivative
sigmoid <- function(lo){
sig <- 1/(1+exp(-lo))
return(sig)
}

#cost function - mean of negative log likelihood function
LL.cost <- function(X,Y,theta){

J <- (-1/n)*sum(Y*log(sigmoid(X%*%theta)) + (1-Y)*log(1-sigmoid(X%*%theta)))

return(J)
}

#first derivatives
gradient.func <- function(X,Y,theta){
G <- (1/n)*(t(X)%*%(sigmoid(X%*%theta) - Y))
return(G)
}

#second derivatives
#not use this function
hessian.func <- function(X,Y,theta){
H <- (1/n)*((t(X)*diag(sigmoid(X%*%theta)*(1-sigmoid(X%*%theta))))%*%X)
return(H)
}

#Logistic regression with Newton Raphson method
newton.method.logisticReg <- function(X, y, theta, num_iter,tol){

summar <- data.frame(H.diag = rep(0,p+1), theta = rep(0,p+1), se.theta=rep(0,p+1))
p <- dim(x)[2]
#iteration to update the theta until the weight is too small
for(i in 1:num_iter){
grad <- gradient.func(X,y,theta)
H <- hessian(LL.cost, X = X, Y = y, theta, method = "complex")
#"complex" method = calculated as the Jacobian of the gradient

H.diag <- diag(ginv(H))/(n)
se.theta <- sqrt(abs(H.diag))
newton.weight <- ginv(H)%*%grad
theta <- theta - newton.weight

summar$theta <- theta

#new hessian with updated theta
H.new <- hessian(LL.cost, X = X, Y = y, theta, method = "complex")
#"complex" method = calculated as the Jacobian of the gradient

H.diag <- diag(ginv(H.new))/(n)
#Standard Error for Coefficients are the square root of the diagonal elements of the Hessian divided by n
se.theta <- sqrt(abs(H.diag))

summar$H.diag <- H.diag
summar$se.theta <- se.theta
summar$z.value <- summar$theta/summar$se.theta
summar$p.value <- pnorm(-abs(summar$theta)/summar$se.theta)*2
summar$lower.conf <- summar$theta - 1.96 * summar$se.theta
summar$upper.conf <- summar$theta + 1.96 * summar$se.theta
summar$loglik <- -LL.cost(X,y,summar$theta)*n
summar$AIC <- -2*summar$loglik + 2*(p+1)

#stop if weights are less than tolerance
if(any(abs(newton.weight)<tol)){
summar$iter <- i
return(summar)
}
}
}

The following part is the example of implementation the functions.

randomData}
1
2
3
4
5
6
7
8
9
10
11
12
13
set.seed(11)

x <- matrix(rnorm(400), ncol = 4) #random predictors
y <- round(runif(100, 0, 1)) # create a binary outcome
n <- length(x)
X <- cbind(rep(1, 100), x)
p <- dim(x)[2] #intercept term (Beta0) - # of predictors
theta<-rep(0, 5)

data1 <- data.frame(cbind(y,x))

result1 <- newton.method.logisticReg(X,y,theta, 20,1e-5)
result1
1
2
3
4
5
6
#fitting by glm syntax built in R
glm1 <- glm(y~x, family = "binomial")

summary(glm1)
logLik(glm1)
AIC(glm1)

The results by the algorithm are almost the same with the result given by the syntax built in R.

Below is the another example with titanic dataset.

Titanic}
1
2
3
4
5
6
7
8
9
10
11
12
13
14
15
16
17
18
19
20
21
22
train<-titanic_train

train <- train %>%
select(subset= -c(PassengerId, Pclass, Name, Sex, Ticket, Cabin, Embarked)) %>%
mutate_all(funs(ifelse(is.na(.), mean(., na.rm=TRUE), .))) %>%
mutate_if(is.integer, as.numeric)

train.indx <- createDataPartition(train$Survived, p=0.7, list=FALSE)

training <- train[train.indx,]
valid <- train[-train.indx,]

x <- as.matrix(training %>% select(-Survived))
y <- training$Survived %>% as.numeric
n <- nrow(x)
X <- cbind(rep(1, nrow(x)), x)
p <- dim(x)[2]
theta<-rep(0, ncol(X))
data1 <- data.frame(cbind(y,x))

result1 <- newton.method.logisticReg(X, y, theta,1000, 1e-15)
result1
1
2
3
4
glm1 <- glm(y~x, family = binomial)
summary(glm1)
logLik(glm1)
AIC(glm1)

Prediction with the calculated $\beta$

Fitting for training dataset.

1
2
3
4
5
6
7
8
#fitting
pred <- as.vector(sigmoid(X%*%result1$theta))
pred.hands <- ifelse(pred > .5, 1, 0)

pred1 <- as.vector(predict(glm1, data1, type="response"))
pred1.hands <- ifelse(pred1 > .5, 1, 0)

identical(pred.hands, pred1.hands)
1
2
3
#Training Accuracy
mean(pred.hands == y)
mean(pred1.hands == y)

For validation dataset,

1
2
3
4
5
6
7
8
9
10
11
12
13
14
15
16
17
18
19

#Validation Accuracy
x <- as.matrix(valid %>% select(-Survived))
y <- valid$Survived %>% as.numeric
n <- nrow(x)
X <- cbind(rep(1, nrow(x)), x)
p <- dim(x)[2]

data1 <- data.frame(cbind(y,x))

pred <- as.vector(sigmoid(X%*%result1$theta))
pred.hands <- ifelse(pred > .5, 1, 0)

pred1 <- as.vector(predict(glm1, data1, type="response"))
pred1.hands <- ifelse(pred1 > .5, 1, 0)

#Validation Accuracy
mean(pred.hands == y)
mean(pred1.hands == y)

You can refer to my Github repository for full implementation in the following;

DavidKwon91

PCA

Introduction to Principal Components Analysis

PCA (Principal Components Analysis) is a popular statistical method to reduce dimensions when the dimension of a dataset is huge, especially, when $n \geq m$ in $m \times n$ matrix or dataset.

Before digging into PCA, I start with some basic of linear algebra.

1. Numerator and Denominator Layout in Matrix Differentiation

In matrix differentiation, there are two notational convention to express the derivative of a vector with respect to a vector, that is $\frac{\partial y}{\partial x}$, which are “Numerator Layout” and “Denominator Layout”.

It doesn’t matter which way you would like to use, but make sure you stick with a notational convention if you start with a particular convention.

Let $x$ be a $n \times 1$ vector, $y$ be a $m \times 1$ vector.

Then, for $\frac{\partial y}{\partial x}$,

Numerator Layout: $m \times n$ matrix as following;

Denominator Layout: $n \times m$ matrix as following;

The different kinds of two notational convention can be found from Wiki

Most of books or papers don’t state which convention they use, but the Denominator Layout is mostly used in many papers or software. This article is going to use Denominator Layout in this article.

2. Variance-Covariance Matrix

Variance-Covariance Matrix, called just Covariance Matrix, of a matrix $X$ can be expressed in two ways as following;

$$S = \frac{1}{n-1} XX^T \tag{1}$$

or

$$S = \frac{1}{n-1} X^{T}X \tag{2}$$

where $X$ is the $m \times n$ matrix.

I will make the data be centered by subtracting the mean of the data for later convenience.

The (1) equation will give you the covariance matrix by row vectors as following;

$$S_{n \times n} = \frac{1}{n-1} X_{n \times 1} X_{1 \times n}^T = \frac{1}{n-1} \sum_{i=1}^{n} (x_i - \mu)(x_i - \mu)^T \tag{3}$$

where $\mu$ is the row mean vector and $S$ will be the $n \times n$ square matrix.

The (2) equation will give you the covariance matrix by column vectors as following;

$$S_{m \times m} = \frac{1}{n-1} X_{m \times 1}^{T}X_{1 \times m} = \frac{1}{n-1} \sum_{i=1}^{m} (x_i - \mu)^{T}(x_i - \mu) \tag{4}$$

where $\mu$ is the column mean vector and $S$ will be the $m \times m$ square matrix.

Example

Let $X$ be $2 \times 3$ matrix as the following;

$$X = \begin{bmatrix} 1 & 2 & 3 \\ 4 & 5 & 6 \end{bmatrix}$$

Then, for (1) equation,

The row vectors will be $3 \times 1$ vector as following;

$X_1 = \begin{bmatrix} 1 \\ 2 \\ 3 \end{bmatrix}$ and $X_2 = \begin{bmatrix} 4 \\ 5 \\ 6 \end{bmatrix}$.

Then, the covariance matrix will be

$$S_{3 \times 3} = \frac{1}{n-1} X_{3 \times 1} X_{1 \times 3}^{T}$$.

For (2) equation,

The column vectors will be $1 \times 2$ vectors as following;

$X_1 = \begin{bmatrix} 1 & 4 \end{bmatrix}$, $X_2 = \begin{bmatrix} 2 & 5 \end{bmatrix}$, $X_3 = \begin{bmatrix} 3 & 6 \end{bmatrix}$.

Then, the covariance matrix will be

$$S_{2 \times 2} = \frac{1}{n-1} X_{2 \times 1}^{T} X_{1 \times 2}$$

In this paper, we will need the (2) covariance matrix since mostly columns are the predictors, and covariance matrix is calculated by the columns.

3. Intuition on Eigenvalues and Eigenvectors

Formal Definition of Eigenvalues and Eigenvectors:

Let A be $n \times n$ a sqaure matrix, then $v$ and $\lambda$ is the Eigenvector and the Eigenvalue of $A$, respectively, if

$$Av = \lambda v \tag{5}$$

where $v$ is a non-zero vector and $\lambda$ can be any scalar.

Geometrical meaning of Eigenvectors and Eigenvalues would be..

From Wiki,

Eigenvectors can be seen the scaled direction vectors in the difrection of the particular vector; therefore, the direction of the vector is preserved, but we are just scaling the lengths.
Eigenvalue can be seen the factor by which it is stretched.

For equation (5), it is equivalent to the following;

$$(A - \lambda I)v = 0$$

where $I$ is the $n \times n$ identity matrix, and $0$ is the zero vector.

Also, if the $(A - \lambda I)$ is invertible, then $v$ can be zero-vector; therefore, in order to have a non-zero vector, $v$, the $(A - \lambda I)$ must be not invertible. It leads the determinant of $(A - \lambda I)$ must be zero as the following;

$$det(A - \lambda I) = 0$$

4. Eigendecomposition or Spectral Decomposition

Let $A$ be $n \times n$ a sqaure matrix with its rank is $n$, $rank(A) = n$, which is equivalent to have the number of linearly independent of columns or rows.

Then, $A$ can be factorized as

$$A_{n \times n} = Q_{n \times n} \Lambda_{n \times n} Q_{n \times n}^{-1}$$

where $Q$ is the $n \times n$ square matrix that the $i$th column is the eigenvector of A, and the $\Lambda$ is the diagonal matrix that the diagonal elements are the eigenvalues of A, $\Lambda_{ii} = \lambda_i$.

If the $Q$ is orthogonal matrix, then $A$ is equivalent to the following;

$$A = Q \Lambda Q^{-1} = Q \Lambda Q^T \tag{6}$$

5. SVD (Singular Value Decomposition)

Let $A$ be $m \times n$ a rectangular matrix, then $A$ can be factorized as,

$$A_{m \times n} = U_{m \times m} \Sigma_{m \times n} V_{n \times n}^{T}$$

where $U$ and $V$ is orthonormal square matrix, which means $U^{T}U = V^{T}V = I$, and $\Sigma$ is the diagonal matrix.

Then, the square matrix,

$$A_{m \times n}A_{n \times m}^{T} = (U \Sigma V^T) (U \Sigma V^T)^T \\ = (U \Sigma V^T) (V \Sigma^{T} U^{T}) \\ = U(\Sigma \Sigma^{T}) U^{T} \tag{7}$$

which gives us $U$ is the eigenvector of $AA^T$ by the definition of Eigendecomposition and the fact that we assume that $U$ is the orthonormal matrix, and $U$ is called left-singular vector.

$$A_{n \times m}^{T}A_{m \times n} = (U \Sigma V^T)^{T} (U \Sigma V^T) \\ = (V \Sigma^{T} U^{T}) (U \Sigma V^T) \\ = V (\Sigma^{T} \Sigma) V^{T} \tag{8}$$

which gives us $V$ is the eigenvector of $A^{T}A$ by the definition of Eigendecomposition and the fact that we assume that $V$ is the orthonormal matrix, and $V$ is called right-singular vector.

Also, $\Sigma \Sigma^{T} = \Sigma^{T} \Sigma$ is the diagonal matrix that the diagonal elements are the eigenvalues.

6. PCA (Principal Components)

The goal of the PCA is to identify the most meaningful basis to re-express a dataset.

Let $X$ be $m \times n$ matrix, $Y$ be another $m \times n$ matrix related by a linear transformation $P_{n \times n}$.

Then,

$$Y = XP \\ = \begin{bmatrix} x_{11} & \dots & x_{1n} \\ \vdots & \ddots \\ x_{m1} & \dots & x_{mn} \end{bmatrix} \begin{bmatrix} p_{11} & \dots & p_{1n} \\ \vdots & \ddots \\ p_{n1} & \dots & p_{nn} \end{bmatrix}$$

which gives us the dot product of $X$ and $P$.

The dot product can be interpreted as a linear transformation or projecting $X$ onto another basis by $P$.

In this case, let’s see the covariance matrix of $Y$. Notice that the covariance matrix of $Y$ or the covariance matrix of $X$ are centered as stated above (3) or (4).

$$C_{Y} = \frac{1}{n-1} Y^{T}Y \\ = \frac{1}{n-1} (XP)^{T}(XP) \\ = \frac{1}{n-1}(P^{T}X^{T}XP) \\ = P^{T}C_{X} P$$

If we prove that the matrix $P$ is orthonormal matrix, then we can see

$$C_{Y} = P^{T}C_{X} P = P^{-1}C_{X} P$$

by (6)

and hence, it implies that $P$ is the eigenvector matrix of covariance matrix of $X$.

  1. First Approach to prove $P$ is orthonormal.

We know that $C_{Y}$ is the symmetric matrix since it is the covariance matrix of $Y$,

then, $C_{Y} = C_{Y}^{T}$ is true.

Let assume that $C_{Y} = P^{-1} C_{X} P$ by definition of Eigendecomposition.

$$C_{Y}^{T} = (P^{-1} C_{X} P)^{T} = (C_{X})^{T} (P^{-1})^{T} \\ = C_{Y} $$

Therefore,

$$P^{T} (C_{X})^{T} (P^{-1})^{T} = P^{T}C_{X} P$$

We know that $C_X = C_{X}^{T}$ since the covariance matrix of $X$ is symmetric matrix.

Finally,

$$P^{T} C_{X} (P^{-1})^{T} = P^{T}C_{X} P \\ (P^{-1})^{T} = P$$

Now, we can see the $P$ is orthonormal matrix.

This proof implies that we can get the $P$ from SVD by calculating $V$.

The covariance matrix of $X$ is..

$$C_X = \frac{1}{n-1} X^{T}X$$

By (8) in SVD, $X^{T}X$ is..

$$X^{T}X = V (\Sigma_{X}^{T} \Sigma_{X}) V^{T}$$

Therefore,

$$V^{T} = P$$

  1. Second Approach to prove $P$ is orthonormal (this proof was provided by a member of my study group)

We have

$$Y = XP$$

where $Y$ is the projected values for $X$ by linear tranformation of $P$.

Suppose we have $U$ as the following;

$$YU = X_{recovered}$$

where $X_{recovered}$ is the re-proejcted values onto original values from the basis where the dataset are projected onto.

Then,

$$XPU = X_{recovered}$$

Therefore,

$$PU = I \tag{9}$$

Let $x$ is column vectors from $X$, and $\hat{x}$ is column vectors from $Y$.

$$x_{n \times 1} \in X_{m \times n}, \hat{x_{n \times 1}} \in Y_{m \times n}$$

The loss function of PCA is

$$\arg\min_{\hat{x}} ||x_{n \times 1} - U_{n \times n}\hat{x_{n \times 1}}||$$

To optimize, we differentiate the equation with respect to $\hat{x}$.

$$\frac{\partial}{\partial \hat{x}} ||x - U\hat{x}|| \\ = \frac{\partial}{\partial \hat{x}} (x-U\hat{x})^{T}(x-U\hat{x}) \\ = \frac{\partial}{\partial \hat{x}} (x^T - \hat{x}^{T}U^{T})(x-U\hat{x}) \\ = \frac{\partial}{\partial \hat{x}} (x^{T}x - \hat{x}^{T}U^{T}x - x^{T}U\hat{x} + \hat{x}^{T}\hat{x}) $$

Here, $\hat{x}^{T}U^{T}x = x^{T}U\hat{x}$ since they are scalar value.

$$= \frac{\partial}{\partial \hat{x}} (x^{T}x - 2x^{T}U\hat{x} + \hat{x}^{T}\hat{x}) \\ = 0 - 2U^{T}x + 2\hat{x} \tag{10}$$

By denominator layout as explained above,

$$\frac{\partial}{\partial \hat{x}} \hat{x}^{T}\hat{x} = 2\hat{x}$$

$$\frac{\partial}{\partial \hat{x}} x^{T}U\hat{x} = (x^{T}U)^{T} = U^{T}x$$

Set the (10) equation as zero,

$$ - 2U^{T}x + 2\hat{x} = 0 \\ \hat{x} = U^{T}x$$

Therefore, $\hat{x} = Px$ from the first assumption, and $P = U^{T}$.

From (9) equation,

$$PU = PP^T = I \\ P^{-1} = P^T$$

We proved that $P$ is the orthonormal matrix.

As a result,

  1. $P$ is the Principal Components that allows us to get the most meaningful basis to re-express our dataset by linear transforming our dataset.
  2. $P$ is the eigenvector matrix of the covariance matrix of our dataset for the column vectors (predictors)
  3. $P$ is the transpose of right-singular vector, which is the $V^T$ in $U \Sigma V^T$, from Singular Value Decomposition.

Reference:
A Tutorial on Principal Component Analysis
Singular Value Decomposition and Principal Component Analysis
HOW ARE PRINCIPAL COMPONENT ANALYSIS AND SINGULAR VALUE DECOMPOSITION RELATED?
Matrix Differentiation
Eigenvalues and eigenvectors
Eigendecompositoin of a matrix
Matrix Calculus
Understanding Principal Component Analysis Once And For All

Classfication

Introduction to Classification Metrics

This paper will discuss on binary classification metrics, Sensitivity vs Specificity, Precision vs Recall, and AUROC.

1. Confusion Matrix

True Positive (TP) - Predicts a value as positive when the value is actually positive.
False Positive (FP) - Predicts a value as positive when the value is actually negative.
True Negative (TN) - Predicts a value as negative when the value is actually negative.
False Negative (FN) - Predicts a value as negative when the value is actually positive.

In Hypothesis test, we used to set up the null hypothesis is the against value.

What this means is that we want to set up the null hypothesis as the value such as a case that a person doesn’t get a disease or a case that a transaction is not a fraud, and the alternative hypothesis as opposite.

For example, we want to test if a patient in a group gets a disease.
Then, null hypothesis, $H_0$, is the patient doesn’t get a disease. With some test, if a p-value, which is the probability that happens an event in the probability distribution of null hypothesis, is less than a value like 0.05, then we reject the null hypothesis and accept the alternative hypothesis, which is to conclude that the patient gets a disease.

Actual Positive ($H_0$ is false) : The patient gets a disease.
Actual Negative ($H_0$ is true) : The patient doesn’t get a disease.

Predicted Positive (Accepting $H_1$: reject $H_0$) : The patient gets a disease
Predicted Negative (not Accepting $H_1$: fail to reject $H_0$) : The patient doesn’t get a disease.

Type 1 Error (False Positive) : When $H_0$ is false, which is that the patient actually gets a disease, but we reject $H_0$ by a classifier, which is that we predict patient doesn’t get a disease.

Type 2 Error (False Negative) : When $H_0$ is true, which is that the patient actually doesn’t get a disease, but we fail to reject $H_0$ by a classifier, which is that we predict patient gets a disease.

2. Metrics

Sensitivity, Recall, or True Positive Rate (TPR) : $\frac{TP}{TP + FN}$

Specificity, True Negative Rate (TNR), 1 - FPR: $\frac{TN}{TN + FP}$

Notice that the denominator for both is the total number of actual value. The denominator of sensitivity is the total number of actual positive value, and the denominator of specificity is the total number of actual negative value.

That means, sensitivity is the probability of correctly predicting positive values among actual positive values. Specificity is the probability of correctly predicting negative values among actual negative values. Therefore, with this metrics, we can see how a model correctly predicts overall actual values for both positive and negative values.

Precision, Positive Predicted Value : $\frac{TP}{TP + FP}$

Recall, Sensitivity, or True Positive Rate (TPR) : $\frac{TP}{TP + FN}$

Here, we can see that the denominator of precision is the total number of predicted value as positive. However, the denominator of recall is the total number of actual positive value.

That means, precision is the probability of correctly predicting positive values among predicted values as positve. This will show how useful the model is, or the quality of the model. Recall is the probability of correctly predicting positive values among actual positive values. This will show how complete the results are, or the quantity of the results.

Therefore, with this metrics, we can see how a model correctly predicts positive values among predicted values and actual values.

In above example of predicting diseased patients, we might want to predict the diseased patients more; therefore, we want to focus on increasing the TRUE POSITIVE values and not focus on predicting TRUE NEGATIVE, but not losing too much predicting accuracy, which is to focus on increasing Precision and Recall.

As a result, sensitivity and specificity is generally used for overall balanced binary target variable or a case that we don’t have to focus on positive or negative values like if it is a dog or a cat in an image classification, but precision and recall should be used to predict an imbalanced binary target variable.

3. Trade-off

It will be the best scenario if we have high performance of sensitivity and specicity or precision and recall. However, in many cases, it is hard to see such cases since there is a trade-off.

For Precision and Recall, the only difference between them is the denominator. The denominator of precision has Type 1 Error (FP), and the denominator of recall has Type 2 Error (FN).

Precision, Positive Predicted Value : $\frac{TP}{TP + FP}$

Recall, Sensitivity, or True Positive Rate (TPR) : $\frac{TP}{TP + FN}$

Precision and Recall shares same parameter, which is TP; therefore, by shifting the threshold of probability that classifies the values, FP and FN values can be varied.

Example codes below with Pima Indians Diabetes

This dataset has imbalanced binary target variable, “diabetes” as below.

I splitted the dataset by training and test set, and performed logistic regression to predict the “diabetes” variable in the test set.

glm.pred1 is the predicted probability values that the patients is diabetes, which is “pos”.

When the threshold is 0.1, which is to classify the predicted value as “pos” if the probability is greater than 0.1.

1
2
pred1 <- as.factor(ifelse(glm.pred1 >= 0.1, "pos","neg"))
confusionMatrix(pred1, as.factor(test$diabetes), positive="pos")

When the threshold is 0.3.

1
2
pred3 <- as.factor(ifelse(glm.pred1 >= 0.3, "pos","neg"))
confusionMatrix(pred3, as.factor(test$diabetes), positive="pos")

When the threshold is 0.5.

1
2
pred5 <- as.factor(ifelse(glm.pred1 >= 0.5, "pos", "neg"))
confusionMatrix(pred5, as.factor(test$diabetes), positive="pos")

When the threshold is 0.7.

1
2
pred7 <- as.factor(ifelse(glm.pred1 >= 0.7, "pos", "neg"))
confusionMatrix(pred7, as.factor(test$diabetes), positive="pos")

As you can see above, by increasing the threshold value, Recall is decreasing, and Precision is increasing by trade-off because the FN is increasing and FP is decreasing. Therefore, we have to find the optimal threshold.

When the threshold is 0.5, we have the best Accuracy with 77.83%.
However, when the threshold is 0.3, it seems to have optimal values for Precision and Recall with..

Precision : 0.6100
Recall : 0.7625

As I told above, when we predict imbalanced binary dataset and we want to focus on predicting the positive values like finding diabetes patients, then we want to increase the Precision and Recall values, even if the Accuracy is not the best value.

In this case, we would select the threshold as 0.3. Or, if the threshold is already set up, then we might have to change our model to improve the Precision and Recall.

The trade-off between Sensitivity and Specificity will be discussed below section, AUROC (Area Under ROC curve)

4. AUROC

ROC (Receiver Operating Characteristic) is a plot used to see the quality of the model in many cases of classification problem. The X-axis of ROC curve is False Positive Rate, and the Y-axis of the curve is True Positive Rate. It is created by various thresholds.

False Positive Rate: $\frac{FP}{FP + TN} = 1 - TNR = 1 - Specificity$

True Positive Rate, also Recall, and Sensitivity: $\frac{TP}{TP + FN}$

Therefore, sensitivty and specificity or ROC curve deal with the each two columns of confusion matrix. We can see the overall accuracy by various thresholds with the metrics for both positive and negative values.

The trade-off between Sensitivity and Specificty or ROC curve is quite similar with the trade-off between Precision and Recall as above example shows.

When threshold is 0.1, the Sensitivity is 0.95, and the Specificity is 0.3467, then the FPR will be $1-0.3467 = 0.6533$.

Threshold is 0.1 :

  • Sensitivity = 0.95
  • Specificity = 0.3467
  • FPR = $1-0.3467 = 0.6533$

Threshold is 0.3 :

  • Sensitivity = 0.7625
  • Specificity = 0.7400
  • FPR = $1-0.7400 = 0.26$

Threshold is 0.5 :

  • Sensitivity = 0.6125
  • Specificity = 0.8667
  • FPR = $1-0.8667 = 0.1333$

Threshold is 0.7 :

  • Sensitivity = 0.4
  • Specificity = 0.9533
  • FPR = $1-0.9533 = 0.0467$

In this scenario, we also would think that when the threshold is 0.3 is the optimal cutoff because they seem the optimal values for both. However, we can see the overall quality of the classifier with the AUC values.

AUC (Area Under Curve) is the area under the ROC curve. The greater the AUC value is, the better classifier we get.

Below is the implementation of my own functions for developing all of the above metrics, such as Precision and Recall, Sensitivity and Specificity, ROC curves, and AUC values.

1
2
3
4
5
6
7
8
9
10
11
12
13
14
15
16
17
18
19
20
21
22
23
24
25
26
27
28
29
30
31
32
33
34
35
36
37
38
39
40
41
42
43
44
45
46
47
48
49
50
51
52
53
54
55
56
57
58
59
60
61
62
63
64
65
66
67
68
69
70
71
72
73
74
75
76
77
78
79
80
81
82
83
84
85
86
87
88
89
90
91
92
93
94
95
96
97
98
99
100
101
102
103
104
105
106
107
108
109
110
111
112
113
114
115
116
#This function creates a dataframe that has TP, TN, FP, and FN values
#This function should have same levels for the both target and pred variable
tptnfpfn <- function(x,y){
tap <- tapply(x,x,length)
f.names <- tap[1] %>% names

if(tap[1] > tap[2]){
target <- ifelse(x == f.names, 0, 1)
pred <- ifelse(y == f.names, 0, 1)
}
if(tap[2] > tap[1]){
target <- ifelse(x == f.names, 1, 0)
pred <- ifelse(y == f.names, 1, 0)
}

#target <- x
#pred <- y

dat <- data.frame(target, pred)

TP <- length(which(dat$target == 1 & dat$pred == 1))
FP <- length(which(dat$target == 0 & dat$pred == 1))
TN <- length(which(dat$target == 0 & dat$pred == 0))
FN <- length(which(dat$target == 1 & dat$pred == 0))

new.dat <- data.frame(TP,FP,TN,FN)
return(new.dat)
}


#Precision = TP / (TP + FP) <- the denominator is total predicted positive values
precision <- function(tp.dat){
precision <- tp.dat$TP / (tp.dat$TP + tp.dat$FP)
return(precision)
}


#Recall = sensitivity = TP / (TP + FN) <- the denominator is total actual positive values

recall <- function(tp.dat){
recall <- tp.dat$TP / (tp.dat$TP + tp.dat$FN)
return(recall)
}

#Sensitivity = Recall

#Specificity = TN / (TN + FP) <- the denominator is total actual negative values
spec <- function(tp.dat){
specificity <- tp.dat$TN / (tp.dat$TN + tp.dat$FP)
return(specificity)
}


#ROC = TPR vs FPR = Recall vs 1-TNR = TP/(TP+FN) vs FP/(FP+TN)
roc.func <- function(target,pred){
dummy <- data.frame(TPR = rep(0, length(target)),
FPR = rep(0, length(target)),
Spec = rep(0,length(target)),
Precision = rep(0, length(target)),
f1score = rep(0, length(target)))

tap <- tapply(target,target,length)
if(tap[1] > tap[2]){
f.name <- levels(as.factor(target))[2]
s.name <- levels(as.factor(target))[1]
}
if(tap[2] > tap[1]){
f.name <- levels(as.factor(target))[1]
s.name <- levels(as.factor(target))[2]
}

for(i in 1:length(target)){
#splitting the probabilities by cutoff with same levels
pred.cutoff <- ifelse(pred >= sort(pred)[i], f.name, s.name)

tptn <- tptnfpfn(target,pred.cutoff)

dummy$cutoff[i] <- sort(pred)[i]
dummy$TPR[i] <- recall(tptn)
dummy$FPR[i] <- tptn$FP / (tptn$FP + tptn$TN)
dummy$Spec[i] <- spec(tptn)
dummy$Precision[i] <- precision(tptn)
dummy$f1score[i] <- f1.score(tptn)
}

#dummy$TPR <- ifelse(dummy$TPR == "NaN", 0, dummy$TPR)
#dummy$FPR <- ifelse(dummy$FPR == "NaN", 0, dummy$FPR)
return(dummy)
}


#This auc function is from below link.
#Refer to
#https://mbq.me/blog/augh-roc/
#a little changes is applied into the codes from above link
#This is using the test statistic from "Mann-Whitney-Wilcoxon test"
#Further link:
#https://en.wikipedia.org/wiki/Mann%E2%80%93Whitney_U_test#Area-under-curve_(AUC)_statistic_for_ROC_curves
auc.func <- function(target, pred){
tap <- tapply(target, target, length)
f.name <- tap[1] %>% names

if(tap[1] > tap[2]){
target1 <- ifelse(target == f.name, TRUE, FALSE)
}
if(tap[2] > tap[1]){
target1 <- ifelse(target == f.name, TRUE, FALSE)
}

n1 <- sum(!target1)
n2 <- sum(target1)
U <- sum(rank(pred)[!target1]) - n1 * (n1 + 1) / 2

return(1 - U / (n1*n2))
}

Below is the results by built-in syntax in R with “ROCR” package

Below is the results by the created functions as above.

Full implementation will be here

Reference:
Precision and Recall
Receiver Operating Characteristic
Type 1 and Type 2 Error
AUC Meets the Wilcoxon-Mann-Whitney U-Statistic

Reticulate

R? Python?

My main language for data analysis is R, but sometimes Python is used for its convenience. I wanted to find a way of using both language interactively in R, and this article is the introduction of a R package, “Reticulate,” which allows us to use both language in R.

Reticulate

The R package, “Reticulate,” is quite recent package published in July 2019. It is still being updated for some issues, but it’s useful if you want use Python modules in R. You can see and download a cheat sheet published in R website, Here.

I performed simple decision tree and XGBoost with Bayesian Optimization with both languages, R and Python, through “Reticulate” package in R, and it works successfully.

For the preparateion to use Reticulate, you have to install or update your R, Rstudio, pip, conda, and Python as the recent version.

You start with installing “reticulate” package in R by

1
2
install.packages("reticulate")
library(reticulate)

And, you can create your virtual environment locally, and make sure you have installed all modules of Python you will use in the environment.

Creation your Python virtual environment with

1
virtualenv_create(envname = "yourname")

Or, you can just use the environment that is already set up in local. Once you have create the environment, then you can see the list of environments with

1
virtualenv_list()

And, you install the python modules into the virtual environment from your local conda or python environment. When you install those Python modules in virtual environment, you have to restart R and make sure the modules that you are going to use has been installed in your virtual environment by

createPythonEnv}
1
2
3
4
5
6
7
8
9
10
11
12
#virtualenv_install("r-reticulate", "bayesian-optimization")
#virtualenv_install("r-reticulate", "pandas")
#virtualenv_install("r-reticulate", "seaborn")
#virtualenv_install("r-reticulate", "sklearn")
#virtualenv_install("r-reticulate", "xgboost")
use_virtualenv("r-reticulate")

py_module_available("seaborn")
py_module_available("sklearn")
py_module_available("pandas")
py_module_available("bayes_opt")
py_module_available("xgboost")

Below is the implementation for simple decision tree in R.

Here is the implementation for simple decision tree with Python Virtual Envrionment in R.

You have to declare that you will be using Python environment by

1
repl_python()

Or, if you are using rMarkdown, then you make chunk with

Performing simple decision tree with Python virtual environment.

You can bring the R objects into Python environment by

1
r.yourobjects

After you are done with Python environment, you call the following codes in your console

You can also bring the Python objects into R environment by

1
py$yourobjects

Here is the full implemented codes for the “reticulate” package.

Monty Hall

Monty Hall Problem with Bayes’ Theorem

Monty Hall Problem is a famous probability problem based on the TV show, “Let’s make a Deal.”

Suppose that you are a contestant and are asked to choose a door among 3 doors, which contains 1 car and 2 goats. If you choose a door that is car behind the door, then you win the prize.

Let C = car behind the door $i$, and D = open door $j$.

Here, we can formulate the probability for the car behind the door as the following:

$$P(C=1) = 1/3 \qquad P(C = 2) = 1/3 \qquad P(C = 3) = 1/3$$

Let’s say you pick the door 1, and host pick one of door 2 or 3, which goat behind the door. You now have a choice whether you stick with the originally chosen door and you switch.

Suppose the host choose the door 3, given that a goat is behind the door 3.

The trick of the probablity here is that the host knows which door has a car behind it and will never open the door. Then, there’s 50-50 chances that one of the two doors, which is not the door that host opens, has a car behind it.

The probability of the door that is chosen by the host, given that the car behind the door, is zero, since the host never pick the door that has a car,
the probability of the door that is chosen by the contestant, given that the car behind the door, is a half, since it is the half probability,
and the probability of the door that is not chosen by the host, given that the car behind the door, is one, because the host never pick the door that has a car and the door that the contestant chose, there’s only one door left.

Then, the likelihood will be

$$P(D = 3 | C = 1) = 1/2 \qquad P(D = 3 | C = 2) = 1 \qquad P(D = 3 | C = 3) = 0 $$

Now, the formula of Bayes Theorem is the following:

$$P(C = i | D = 3) = \frac{P(D = 3 | C = i)P(C = i)}{P(D = 3)}$$

It is easy to answer that the probability for $P(D = 3)$ is $\frac{1}{2}$, because you already choose door 1, and the host will choose one of the rest 2 doors. However, we can calculate the marginal probability for $P(D = 3)$ as the following.

$$P(D = 3) = \sum_{i=1}^{3} P(C = i, D = 3) = \sum_{i=1}^{3} P(D = 3 | C = i)P(C = i) = \\ P(D = 3 | C = 1)P(C = 1) + P(D = 3 | C = 2)P(C = 2) + P(D = 3 | C = 3)P(C = 3) = \\ \frac{1}{3} \times \frac{1}{2} + \frac{1}{3} \times 1 + \frac{1}{3} \times 0 = \frac{1}{2}$$

Now, let’s calculate the posterior probability in the Bayes Theorem, which is the probability of the door has a car behind it, given the door 3 has opened.

$$P(C = 1 | D = 3) = \frac{P(D = 3 |C = 1)P(C = 1)}{P(D = 3)} = \frac{\frac{1}{2} \times \frac{1}{3}}{\frac{1}{2}} = \frac{1}{3}$$

$$P(C = 2 | D = 3) = \frac{P(D = 3 |C = 2)P(C = 2)}{P(D = 3)} = \frac{1 \times \frac{1}{3}}{\frac{1}{2}} = \frac{2}{3}$$

$$P(C = 3 | D = 3) = \frac{P(D = 3 |C = 3)P(C = 3)}{P(D = 3)} = \frac{0 \times \frac{1}{3}}{\frac{1}{2}} = 0$$

Therefore, as a contestant, you have to switch your choice to door 2 that has more probability than the door you chose at the first time.

DecisionTree

Introduction to Decision Tree

In this post, I will discuss about Decision Tree, which is the fundamental algorithm of the well-known Tree-based algorithms. This post will also address two metrics that are employed in Decision tree and many other machine learning algorithms, even in deep learning.

1. Metric

Why do we need the “Metric” in tree-based algorithm?

The answer will be to find the best splits in the tree. We use the metric, calculate a variable, measure the split score with the value, and choose the value for the best split at each step of finding the split or the predictors in the tree. Many other metrics or score functions are used to find the “best” split for different tree-based algorithms. Two metrics will be discussed, which are Gini Impurity (or Gini Index) and Information Gain with Entropy.

1.1 Gini Index

Suppose we have a dependent categorical variable, which have $\mathcal{J}$ classes. Let $i \in \{1,2,…,\mathcal{J}\}$ and $p_i$ is the probability given each factor levels of dependent variable.d

Then, the Gini Index, or Gini Impurity is defined as below,

$$I_{\mathcal{G}}(p) = \sum_{i=1}^{J}p_i \sum_{k \neq i}p_k = \sum_{i=1}^{J}p_i(1-p_i) = \sum_{i=1}^{J}(p_i-p_i^2) = \sum_{i=1}^{J}p_i - \sum_{i=1}^{J}p_i^2 \\ = 1-\sum_{i=1}^{J}p_i^2$$

For example,

suppose we have a binary variable that follows below.

$X = [FALSE,FALSE,TRUE,TRUE,….,TRUE,FALSE]$

Then, the Gini Impurity will be the followng by the definition,

$$1 - (\frac{8}{20})^2 - (\frac{12}{20})^2 = 0.48$$

What about the Gini Impurity for this binary variable?

Then, the Gini Impurity will be

$$1 - (\frac{1}{20})^2 - (\frac{19}{20})^2 = 0.095$$

Now, we see that the smaller Gini Impurity is, we find the better split point.

Therefore, we want to find the smaller Gini Impurity score as possible as we can at each step to find best split in the tree.

Now, let we have two binary variables and make table for each factors like the below,

$$Y = [FALSE, FALSE, … , TRUE] \\ X = [YES, YES, … , NO]$$

And, we want to predict $Y$ with $X$.

We will have only one stump in a Decision Tree for this table. The root node, which is the very top of the tree, will be the predictor, $X = [YES, YES, … , NO]$

The tree is something like..

The typical tree in real world is much more complicated with more nodes and splits, since they have many predictors.
This tree that has only one split is sometimes called a stump, which is often called a weak learner in Adaboost.
But, I will just call this as a tree for this example.

Then, the process of finding Gini Impurity is the below;

1) Find Conditional probability

For example, the Conditional probability given $X$ is

$$P(Y = FALSE |X = YES) = \frac{5}{7} \\ P(Y = TRUE | X = YES) = \frac{2}{7} \\ P(Y = FALSE | X = NO) = \frac{3}{13} \\ P(Y = TRUE | X = NO) = \frac{10}{13}$$

2) Find each Gini Index for the conditional probability

$$I_{Gini}(Y|X=YES) = 1 - (\frac{5}{7})^2 - (\frac{2}{7})^2 = 0.4081633 \\ I_{Gini}(Y|X=NO) = 1 - (\frac{3}{13})^2 - (\frac{10}{13})^2 = 0.3550296 $$

Then, we find a Gini Impurity score for a leaf node in this tree, which is the very bottom of the tree or the final classification.

3) Find Marginal probability

The margianl probabilty given $X$ is

$$P_X(X=YES) = \frac{7}{20} \\ P_X(X=NO) = \frac{13}{20}$$

Since the tree is splitted by $X$, we find the Gini Impurity of the total tree.

4) Multiply and add the Gini Index and marginal probability associated with the given probability respectively. Finally, we have Gini Impurity Score for a split.

Then, the Total Gini Impurity Score for this tree is,

$$I_{Gini}(Y|X=YES) \times P_X(X=YES) + I_{Gini}(Y|X=NO) \times P_X(X=NO) = \\ 0.4081633 \times \frac{7}{20} + 0.3550296 \times \frac{13}{20} = 0.3736264$$

Then, we eventually find the total Gini Impurity score for a tree.

In real world problem, we have many predictors and so many nodes, possibly many trees such in Random Forest.

With this process of finding Gini Impurity, we compare the Gini score and find the best split point of the best predictor with best splits.

1.2 Entropy

Entropy is defined as below;

$$H(T) = -\sum_{i=1}^{J}p_ilog_2(p_i)$$

And the process of finding best split in a tree is to find the Information Gain.

The Information Gain is often called Kullback-Leiber divergence and defined as below;

$$IG(T,a) = H(T) - H(T|a)$$

where $IG(Y,X)$ is the Information Gain of Y given X, $H(Y)$ is the parent Entropy of Y, and $H(Y|X)$ is the children Entropy of Y given X, and the $H(Y|X)$ is often called cross-entropy.

The process of finding Information Gain is very similar to the Gini Score, but here we find the bigger value of IG.

I will use the same example problem as above.

For the above example,

$$Y = [FALSE, FALSE, … , TRUE] \\ X = [YES, YES, … , NO]$$

Then, as I have shown, find the conditional probability.

1) Find the conditional probability given $X$

$$P(Y = FALSE |X = YES) = \frac{5}{7} \\ P(Y = TRUE | X = YES) = \frac{2}{7} \\ P(Y = FALSE | X = NO) = \frac{3}{13} \\ P(Y = TRUE | X = NO) = \frac{10}{13}$$

2) Find the entropy given $X$

$$I_{Entropy}(Y|X=YES) = -\frac{5}{7}log_2(\frac{5}{7}) - \frac{2}{7}log_2(\frac{2}{7}) = 0.8631206\\ I_{Entropy}(Y|X=NO) = -\frac{3}{13}log_2(\frac{3}{13}) - \frac{10}{13}log_2(\frac{10}{13}) = 0.7793498 $$

3) Find the marginal probability

The margianl probabilty given $X$ is

$$P_X(X=YES) = \frac{7}{20} \\ P_X(X=NO) = \frac{13}{20}$$

4) Calculate the Total Entropy and Cross-Entropy

Total Entropy for a tree divided by $X$ is

$$-P_X(X=YES) \times log_2(P_X(X=YES))-P_X(X=NO) \times log_2(P_X(X=NO)) \\ = -\frac{7}{20}log_2(\frac{7}{20}) - \frac{13}{20}log_2(\frac{13}{20}) \\ = 0.9340681$$

Cross Entropy for a leaf node is

$$I_{Entropy}(Y|X=YES) \times P_X(X=YES) + I_{Entropy}(Y|X=NO) \times P_X(X=NO) \\ = 0.8631206 \times \frac{7}{20} + 0.7793498 \times \frac{13}{20} \\ = 0.8086696$$

5) Find Information Gain with Total Entropy and Cross Entropy

Information Gain = Total Entropy - Cross Entropy

$$= 0.9340681 - 0.8086696 = 0.1253985$$

For another example that shows why bigger Information Gain is better,

suppose we have the dataset following;

It’s obviously better to split for Y given X than the above example, since this has only one mistake.

If we find the Information Gain of this data,

The Total Entropy for a tree divided by $X$ is 1, since this splits exactly the same number of target observations with 10 and 10.

$$-P_X(X=YES) \times log_2(P_X(X=YES))-P_X(X=NO) \times log_2(P_X(X=NO)) = \\ -\frac{10}{20}log_2(\frac{10}{20}) - \frac{10}{20}log_2(\frac{10}{20}) \\ = 0.5 + 0.5 = 1$$

The cross entropy for a leaf node is

$$I_{Entropy}(Y|X=YES) \times P_X(X=YES) + I_{Entropy}(Y|X=NO) \times P_X(X=NO) \\ = 0.234478$$

calculated by the same process of the above.

Then, the Information Gain is

$$1 - 0.234478 = 0.7655022$$

Therefore, we find the bigger Information Gain as possible as we can.

As a summary, Decision Tree Algorithm is..

1) Find the best split with the metric score for each splits and each predictors.

2) Compare the metric score with every splits and other predictors and find the best split and best predictors.

3) The best predictors that has the best metric score will be the roof node, and keep building a tree with the metric scores.

4) The very bottom of the tree, which is the leaf node, will be our final classification.

If we have continuous predictors, there is no split point like “YES” or “NO”. Therefore,

1) we sort the data associated with the numerical predictors,

2) calculate the average for all adjacent indexes of the numerical predictor,

find the Gini Impurity for all the adjacent average value,

and compare the Gini Impurity to find the best split point of adjacent average of the numerical predictors.

Below is the Implementation in R. I used iris dataset, and a dataset that I created.
Some of codes are skipped, and you can refer to my Gibhub website to see full algorithm.

DavidGithub

1
2
3
4
5
6
7
8
9
10
#removing one of the classes of the target variable, virginica in Iris Dataset. 
#to make target as a binary variable
iris1 <- iris[which(iris$Species != "virginica"),]

#removing the factor level that we don't have any more
iris1$Species <- as.factor(as.character(iris1$Species))

#quick decision tree built in R, rpart
tr <- rpart(Species~., training)
rpart.plot(tr)

This is the prediction by Decision Tree built in R.

Here is the Decision Tree algorithm with the introduced two metrics that I built.

1
2
3
4
5
6
7
8
9
10
11
12
13
14
15
16
17
18
19
20
21
22
23
24
25
26
27
28
29
30
31
32
33
34
35
36
37
38
39
40
41
42
43
44
45
46
47
48
49
50
51
52
53
54
55
56
57
58
59
60
61
62
63
64
65
66
67
68
69
70
71
72
73
74
75
76
77
78
79
80
81
82
83
84
85
86
87
88
89
90
91
92
93
94
95
96
97
98
99
100
101
102
103
104
105
106
107
108
109
110
111
112
113
114
115
116
117
118
119
120
121
122
123
124
125
126
127
128
129
130
131
132
133
134
135
136
137
138
139
140
141
142
143
144
145
#average function to create adjacent average between predictor indexes
avg <- function(x1,x2){sum(x1,x2)/2}

#gini function for a leaf
gini <- function(x){

if(dim(x)[1]==1){
return(1)
}
else{
#conditional probability given predictor (row : target, column : predictor)
p11<-x[1,1]/sum(x[,1])
p21<-x[2,1]/sum(x[,1])
p12<-x[1,2]/sum(x[,2])
p22<-x[2,2]/sum(x[,2])

a.false.gini <- 1-p11^2-p21^2
a.true.gini <- 1-p12^2-p22^2

#marginal probability
a.false.prob <- (x[1,1]+x[1,2]) / sum(x)
a.true.prob <- (x[2,1]+x[2,2]) / sum(x)

gini.imp <- a.false.prob * a.false.gini + a.true.prob * a.true.gini
return(gini.imp)
}
}


#log function with base 2 for entropy
log2 <- function(x){
if(x!=0){
return(log(x,base=2))
}
if(x==0){
return(0)
}
}


#entropy function for a leaf
entropy <- function(x){

if(dim(x)[1]==1){
return(0)
}
else{
#conditional probability given predictor (row : target, column : predictor)
p11<-x[1,1]/sum(x[,1])
p21<-x[2,1]/sum(x[,1])
p12<-x[1,2]/sum(x[,2])
p22<-x[2,2]/sum(x[,2])

#Calculating weights, which is the bottom of the tree
a.false.entropy <- -(p11*log2(p11)+p21*log2(p21))
a.true.entropy <- -(p12*log2(p12)+p22*log2(p22))

#marginal probability
a.false.prob <- (x[1,1]+x[2,1]) / sum(x)
a.true.prob <- (x[1,2]+x[2,2]) / sum(x)

#cross entropy
weighted.entropy <- a.true.prob*a.true.entropy + a.false.prob*a.false.entropy

#total entropy
total.entropy <- -(a.false.prob*log2(a.false.prob) + a.true.prob*log2(a.true.prob))

#Information Gain, which is the tree score to find best split
#If the bigger this value is, we find the better split
#maximum value is 1
IG <- total.entropy - weighted.entropy

return(IG)
}
}


#Calculating impurity to find which predictor is the best to split, which will be the top of the tree or first split in the tree
var.impurity <- function(x, dat, fun){
imp.dat <- data.frame(matrix(0, nrow=nrow(dat)-1, ncol=3))
colnames(imp.dat) <- c("index", "impurity", "adj.avg")


for(i in 1:(nrow(dat)-1)){
imp.dat[i,1] <- paste0("between ", i, " and ", i+1)
#average value of the adjacent values
a <- avg(x[i], x[i+1])

predictor.name <- colnames(dat)[which(sapply(dat, function(x,want) isTRUE(all.equal(x,want)),x)==TRUE)]

#Sorting the data by the predictor
dat1 <- dat[order(x,decreasing=FALSE),]
mat <- as.matrix(table(dat1[,predictor.name] < a, dat1[,target] ))

#apply the metric, Gini or Entropy
imp.dat[i,2] <- fun(mat)
imp.dat[i,3] <- a
}
return(imp.dat)
}


#this function will give you the best split score for each predictors
impurity.fun <- function(dat, fun){
predictors <- colnames(dat)[!colnames(dat) %in% target]
var.impur.dat <- data.frame(matrix(0, nrow=length(predictors),ncol=2))
colnames(var.impur.dat) <- c("var", "impurity")

for(i in 1:(ncol(dat)-1)){
var.impur.dat[i,1] <- predictors[i]
if(fun == "gini"){
#the least score of gini is the best split
var.impur.dat[i,2] <- min(var.impurity(dat[,i], dat, gini)$impurity)
}
if(fun == "entropy"){
#the greates score of entropy is the best split
var.impur.dat[i,2] <- max(var.impurity(dat[,i], dat, entropy)$impurity)
}
}
return(var.impur.dat)
}


#give you the best predictor to split or the top of the tree
topTree.predictor <- function(x,fun){
if(fun == "entropy"){
return(which.max(impurity.fun(x, "entropy")[,2]))
}
if(fun == "gini"){
return(which.min(impurity.fun(x, "gini")[,2]))
}
}

#The best split point associated with the best predictor
impurityOfbest <- function(dat, best.pred, fun){
if(fun == "entropy"){
impurity.pred <- var.impurity(dat[,best.pred], dat, entropy)$adj.avg[which.max(var.impurity(dat[,best.pred], dat, entropy)$impurity)]
}
if(fun == "gini"){
impurity.pred <- var.impurity(dat[,best.pred], dat, gini)$adj.avg[which.min(var.impurity(dat[,best.pred], dat, gini)$impurity)]
}

print(paste0("Best predictor, which is top tree node is ", colnames(dat)[best.pred], " with best split is ", impurity.pred, " by the metric, ", fun))
return(impurity.pred)
}
1
2
3
4
5
6
7
8
9
10
11
12
13
14
15
16
17
18
19
20
21
22
23
24
25
26
27
#by Entropy metric, we want to find the maximum entropy score
fun <- "entropy"
target <- "Species"

imp.pred <- topTree.predictor(iris1, fun) #This is the best predictor that splits our target the best.
best.impur <- impurityOfbest(iris1, imp.pred, fun) #This is the best split point for the best predictor.


#Let's see how well this value calculated by the function predicts
table(iris1[,imp.pred] < best.impur, iris1$Species)
#perfectly predicted in training set


pred.by<- as.factor(ifelse(iris1[,imp.pred] < best.impur, "setosa","versiclor"))

t1 <- iris1 %>%
ggplot(aes(x=Petal.Width, y=Petal.Length ,col=Species)) +
geom_jitter() +
ggtitle("Actual")
t2 <- iris1 %>%
ggplot(aes(x=Petal.Width, y=Petal.Length ,col=pred.by)) +
geom_jitter() +
geom_vline(xintercept = best.impur, colour="blue", linetype="dashed") +
annotate(geom="text", label=best.impur, x=best.impur, y=0, vjust=-1) +
ggtitle("Predicted")

grid.arrange(t1,t2)

GaussianProcess

Introduction to Gaussian Process

In this post, I will discuss about Gaussian Process, which employs Gaussian distribution (also often called normal distribution that plays an important role in statistics. The previous posts, such as CLT, Cholesky Decomposition, and Schur Complement, are posted because they are needed to understand the Gaussian Process.

Before I start with Gaussian Process, some important properties of Gaussian Distribution will be addressed.

$\large{Gaussian}$ $\large{ Distribution}$

If we have random vector $X$ following Gaussian Distribution, then we have

$$X = \begin{bmatrix} X_1 \\ X_2 \\ … \\ X_n \end{bmatrix} \sim \mathcal{N}(\mu, \Sigma)$$

where $\Sigma = Cov(X_i, X_j) = E[(X_i - \mu_i)(X_j - \mu_j)^{T}]$

Now, Suppose we have two vectors, $X$ and $Y$ that are subsets of a random variable, Z, with the following;

$$P_Z = P_{X,Y} = \begin{bmatrix} X \\ Y \end{bmatrix} \sim \mathcal{N}(\mu, \Sigma) = \mathcal{N}(\begin{bmatrix} \mu_X \\ \mu_Y \end{bmatrix}, \begin{bmatrix} \Sigma_{XX} & \Sigma_{XY} \\ \Sigma_{YX} & \Sigma_{YY} \end{bmatrix})$$

Then, the following properties holds;

1. Normalization

The density function will be

$$\int_{Z} p(Z;\mu,\Sigma) dz = 1$$

where $Z = \begin{bmatrix} X \\ Y \end{bmatrix}$

2. Marginalization

The maginal densities will be

$$p(X) = \int_{Y} p(X,Y; \mu, \Sigma) dy \\ p(Y) = \int_{X} p(X,Y; \mu, \Sigma) dx$$

which are Gaussian, therefore

$$X \sim \mathcal{N}(\mu_X, \Sigma_{XX}) \\ Y \sim \mathcal{N}(\mu_Y, \Sigma_{YY})$$

3. Conditioning

The conditional densities will also be Gaussian, and the conditional expected value and covariance are calculated with the properties of Schur Complement as the following.

Refer to the wiki, Schur Complement.

The conditional expectation and covariance of X given Y is the Schur Complement of C in $\Sigma$ where if $\Sigma$ is defined as

$$\Sigma = \begin{bmatrix} A & B \\ B^{T} & C \end{bmatrix}$$

$$Cov(X|Y) = A-BC^{-1}B^{T} \\ E(X|Y) = E(X) + BC^{-1}(Y-E(Y))$$

Hence, the conditional covariance of X given Y will be

$$P_{X,Y} = \mathcal{N}(\begin{bmatrix} \mu_X \\ \mu_Y \end{bmatrix}, \begin{bmatrix} \Sigma_{XX} & \Sigma_{XY} \\ \Sigma_{YX} & \Sigma_{YY} \end{bmatrix})$$

$$X | Y \sim \mathcal{N}(\mu_X + \Sigma_{XY}\Sigma_{YY}^{-1}(Y-\mu_Y), \Sigma_{XX} - \Sigma_{XY}\Sigma_{YY}^{-1}\Sigma_{YX}) \\
Y | X \sim \mathcal{N}(\mu_Y + \Sigma_{YX}\Sigma_{XX}^{-1}(X-\mu_X), \Sigma_{YY} - \Sigma_{YX}\Sigma_{XX}^{-1}\Sigma_{XY})$$

4. Summation

The sum of independent Gaussian random variables is also Gaussian;

Let $y \sim \mathcal{N}(\mu, \Sigma)$ and $z \sim \mathcal{N}(\mu’,\Sigma’)$

Then,

$$y + z \sim \mathcal{N}(\mu + \mu’, \Sigma+\Sigma’)$$

We see some of important properties of Gaussian distribution.

Now, let’s change our focus to linear regression problem.

Typical linear regression equation is defined as,

$$y = ax + b$$

Or,

$$y = \beta_0 + \beta_1X_1 + … + \beta_pX_p + \epsilon$$

And, it can be expressed by

$$y = f(x) + \epsilon$$

where $f(x) = \beta_0 + \beta_1X_1 + … + \beta_pX_p$.

Here, an important assumption of linear regression is that the error term, $\epsilon$ is normally distributed with mean zero.

If we consider repeated sampling from our population, for large sample sizes, the distribution of the ordinary least squared estimates of the regression coefficients follow a normal distribution by the Central Limit Theorem.

Refer to the previous post, Central Limit Theorem

Therefore, the $\epsilon$ follows Gaussian Distribution.

We might then think about what if our $f(x)$ follows Gaussian distribution.

Then, in the above equation, $y = f(x) + \epsilon$ will follow Gaussian distribution by the property that the sum of two independent Gaussian distribution is Gaussian distribution.

Here is the start of the Gaussian Process.

$\large{Gaussian}$ $\large{ Process}$

A Gaussian Process is one of stochastic process that is a collection of random variables, ${f(x) : x \in \mathcal{X}}$, indexed by elements from some set $\mathcal{X}$, known as the index set, and GP is such stochastic process that any finite subcollection of random variables has a multivariate Gaussian distribution.

Here, we assume the $f(x)$ follows Gaussian distribution with some $\mu$ and $\Sigma$.

The $\mu$ and $\Sigma$ are called as “mean function” and “covariance function” with the notation,

$$f(.) \sim \mathcal{GP}(m(.), k(.,.))$$

where $k(.,.)$ is covariance function and a kernel function.

Hence, we have the equation,

$$y^{i} = f(x^{i}) + \epsilon^{i}$$

where the error term (“noise”), $\epsilon^{i}$ with independent $\mathcal{N}(0, \sigma^2)$ distribution.

We assume the prior distribution over the function $f(.)$ with mean zero Gaussian;

$$f(.) \sim \mathcal{GP}(0, k(.,.))$$

for some valid kernel function $k(.,.)$.

Now, we can convert the $\mathcal{GP}$ prior $f(.)$ into a $\mathcal{GP}$ posterior function after having some data to make predictions $f_p$.

Then, the two functions for the training ($f(.)$) and test ($f_p(.)$), will follows

$$\begin{bmatrix} f \\ f_p \end{bmatrix}|X,X_p \sim \mathcal{N}\big(0, \begin{bmatrix} K(X,X) & K(X, X_p) \\ K(X_p, X) & K(X_p, X_p) \end{bmatrix}\big)$$

Now, with $\epsilon$ and $\epsilon_p$,

$$\begin{bmatrix} \epsilon \\ \epsilon_p\end{bmatrix} \sim \mathcal{N}(0,\begin{bmatrix} \sigma^2I & 0 \\ 0^{T} & \sigma^2I\end{bmatrix})$$

As mentioned above, the sum of two independent Gaussian distribution is also Gaussian, then eventually we have,

$$\begin{bmatrix} y \\ y_p \end{bmatrix} | X, X_p = \begin{bmatrix} f \\ f_p \end{bmatrix} + \begin{bmatrix} \epsilon \\ \epsilon_p\end{bmatrix} \sim \mathcal{N}(0, \begin{bmatrix} K(X,X) + \sigma^2I & K(X,X_p) \\ K(X_p, X) & K(X_p,X_p)+\sigma^2I \end{bmatrix})$$

Here, we generate the prior distributions, which are multivariate normal distributions, with standard multivariate normal distribution and the Cholesky factor as the following.

Refer to my previous post for Cholesky Decomposition, Cholesky Decomposition post.

1) Compute covariance function, $\Sigma$, and Cholesky Decomposition for $\Sigma = LL^{T}$

2) Generate standard multivariate normal distribution, $u \sim \mathcal{N}(0,1)$

3) Compute $x = \mu + Lu$, then $x$ will the prior distribution for $\mathcal{GP}$.

Back to our prediction with GP, we have

$$y_p|y,X,X_p \sim \mathcal{N}(\mu_p, \Sigma_p)$$

by the rules for conditioning Gaussians as we have done above.

Then, we have

$$\mu_p = K(X_p, X)K((X,X)+\sigma^2I)^{-1}y \\ \Sigma_p = K(X_p, X_p) + \sigma^2I - K(X_p,X)(K(X,X)+\sigma^2I)^{-1}K(X,X_p)$$

Here, the conditional mean and covariance function are calculated by the Schur Complement as shown above, and since the mean is zero vector, the mean function is defined as the above.

Conditional expectation and covariance with Schur Complement again,

$$\Sigma = \begin{bmatrix} A & B \\ B^{T} & C \end{bmatrix}$$

$$Cov(X|Y) = A-BC^{-1}B^{T} \\ E(X|Y) = E(X) + BC^{-1}(Y-E(Y))$$

Here, the $E(X)$ and $E(Y) = 0$ for $\mathcal{GP}$, thus we have just $BC^{-1}Y$ term, which is $\mu_p = K(X_p, X)K((X,X)+\sigma^2I)^{-1}y$

Kernel Function, $K(.,.)$?

Commonly used kernel function for $\mathcal{GP}$ is squared exponential kernel function, which is often called Gaussian kernel.

It’s defined as,

$$K(X,X_p) = exp(-\frac{1}{2\nu} ||X-X_p||^2) = exp(-\frac{1}{2\nu} (X-X_p)^{T}(X-X_p))$$

where the $\nu$ is the free parameter for bandwidth of the function smoothness.

Here is the implementation of Gaussian Process in R.

1
2
3
4
5
6
7
8
9
10
11
12
13
14
15
16
17
18
19
20
21
22
23
24
25
26
27
28
29
30
31
xcor <- seq(-5,4.9,by=0.1) #index or coordinate for our data

#Kernel Function (Squared exponential kernel function or Gaussian kernel function)
GP.kernel <- function(x1,x2,l){
mat <- matrix(rep(0, length(x1)*length(x2)), nrow=length(x1))
for (i in 1:length(x1)) {
for (j in 1:length(x2)) {
mat[i,j] <- (x1[i]-x2[j])^2
}
}
kern <- exp(-(0.5*mat)/l) #l is free parameter that can be seen as bandwidth
return(kern)
}


#Zero-mean and covariance function by the squared exponential kernel function with the index to create prior distribution
mu <- rep(0,length(xcor))
cov <- GP.kernel(xcor,xcor,1) #nu is 1


#3 prior distributions
dat <- data.frame(x=xcor, first=mvrnorm(1,mu,cov), sec=mvrnorm(1,mu,cov), thi=mvrnorm(1,mu,cov))
#mvrnorm function is same with the using of Cholesky factor of the covariance function multiplied by the standard multivariate normal distribution added mu


#graph for the 3 priors
dat %>% ggplot() +
geom_line(aes(x=xcor,y=first, colour="red")) +
geom_line(aes(x=xcor,y=sec, colour="blue")) +
geom_line(aes(x=xcor,y=thi, colour="green"))
1
2
3
4
5
6
7
8
9
10
11
12
13
14
15
16
17
18
19
20
21
22
23
24
25
26
27
28
29
#Assume we have a data

#5 elements
f <- data.frame(x=c(-4,-3,-1,0,2),
y=c(-2,0,1,2,-1))
x <- f$x
k.xx <- GP.kernel(x,x,1)
k.xxs <- GP.kernel(x,xcor,1)
k.xsxs <- GP.kernel(xcor,xcor,1)


f.star.bar <- t(k.xxs)%*%solve(k.xx)%*%f$y #mean function
cov.f.star <- k.xsxs - t(k.xxs)%*%solve(k.xx)%*%k.xxs #covariance function

#posterior distribution
dat1 <- data.frame(x=xcor,
first=mvrnorm(1,f.star.bar,cov.f.star),
sec=mvrnorm(1,f.star.bar,cov.f.star),
thi=mvrnorm(1,f.star.bar,cov.f.star))

#graph for 3 posterior distribution when nu is 1
dat1 %>% ggplot() +
geom_line(aes(x=xcor,y=first, colour="red")) +
geom_line(aes(x=xcor,y=sec, colour="blue")) +
geom_line(aes(x=xcor,y=thi, colour="green")) +
geom_line(aes(x=xcor,y=f.star.bar),colour="black")+
geom_errorbar(data=f, aes(x=x, y=NULL, ymin=y-2*0.1, ymax=y+2*0.1),width=0.2)+
geom_point(data=f,aes(x=x,y=y)) +
ggtitle("Posterior from Prior x likelihood/evidence (given x,x*,y)")
1
2
3
4
5
6
7
8
9
10
11
12
13
14
15
16
17
18
19
20
21
22
23
24

mu <- rep(0,length(xcor))
cov <- GP.kernel(xcor,xcor,0.1) #nu is 0.1

dat <- data.frame(x=xcor, first=mvrnorm(1,mu,cov), sec=mvrnorm(1,mu,cov), thi=mvrnorm(1,mu,cov))

dat %>% ggplot() +
geom_line(aes(x=xcor,y=first, colour="red")) +
geom_line(aes(x=xcor,y=sec, colour="blue")) +
geom_line(aes(x=xcor,y=thi, colour="green")) +
ggtitle("When sigma is 0.1")


mu <- rep(0,length(xcor))
cov <- GP.kernel(xcor,xcor,10) #nu is 10


dat <- data.frame(x=xcor, first=mvrnorm(1,mu,cov), sec=mvrnorm(1,mu,cov), thi=mvrnorm(1,mu,cov))

dat %>% ggplot() +
geom_line(aes(x=xcor,y=first, colour="red")) +
geom_line(aes(x=xcor,y=sec, colour="blue")) +
geom_line(aes(x=xcor,y=thi, colour="green")) +
ggtitle("When sigma is 10")

Reference:

Gaussian Process
Gaussian Process
A Visual Exploration of Gaussian Process
Gaussian Process: A Basic Properties and GP regression
Gaussian Process regression with R

and my previous posts,

Cholesky Decomposition
Central Limit Theorem
Schur Complement

No Leaders Please

In the great poem by Charles Bukowski,

“No Leaders Please”

Invent yourself, reinvent yourself.

Don’t swim in the same slough.

Invent yourself, reinvent yourself,

and stay out of the clutches of mediocrity.

Change your tone and shape so often that they can never categorize you.

Reinvigorate yourself, and accept what is.

But only on the terms that you have invented and reinvented.

Be self-taught.

And reinvent your life.

Because your must.

It is your life
and its history
and the present
belong only to you.

Histogram

Creating Histogram function using Min-max transformation.

The histogram plot of a vector or a data feature is to create bins, which is to create a series of interval, for the range of data values, and to count how many data values fall into each bins.

I create bins as the following;

Suppose we have $M$ bins, then

$$B_1 = [0,\frac{1}{M}), B_2 = [\frac{1}{M}, \frac{2}{M}), …, B_{M-1} = [\frac{M-2}{M}, \frac{M-1}{M}), B_{M} = [\frac{M-1}{M}, 1)$$

To create histogram function with the bins, I wanted to transform the data elements in interval $(0,1)$, so I can put them into each bins.

That’s why I used Min-max transformation, which makes the data reducing to a scale between 0 and 1.

Min-max transformation is the following formula;

$$z = \frac{x-min(x)}{max(x)-min(x)}$$

The below codes are the implementation of creating histogram plot in R. I used the values from CLT posts.

CLT link

1
2
3
4
5
6
7
8
9
10
11
12
13
14
15
16
17
18
19
20
21

Hist <- function(vec,bin){
vec.minmax <- (vec - min(vec))/(max(vec)-min(vec)) #min-max transformation of the vector or the values

vec.bins <- rep(0,bin)
for(i in 1:bin){
#find the values that is the closest to the value of each boundary of the bins
vec.bins[i] <- vec[which(abs(vec.minmax - i/bin) == min(abs(vec.minmax - i/bin)))]
}

dat <- data.frame(x=vec.bins, freq=0)
for(i in 1:bin){
#put the values into each bins associateed
dat[i,2] <- length(which(vec.minmax > (i-1)/bin & vec.minmax <= i/bin))
}

#plotting
p <- dat %>% ggplot(aes(x=x, y=freq)) + geom_bar(stat="identity", position=position_dodge(width=0.5)) + theme_bw()

return(p)
}
1
Hist(sampled.1000,15)
1
Hist(sampled.10000,15)
1
Hist(bin.sampled.10000,15)

Reference:
Histogram and Kernel Density EStimation
Histogram from Scratch

Your browser is out-of-date!

Update your browser to view this website correctly. Update my browser now

×